Hello, I'm
Exploring the world of data to find patterns that inspire smarter decisions. I love transforming raw data into powerful stories through analytics.
Scroll Down
I am a passionate Data Analyst with a strong foundation in science and computing, currently pursuing an MCA at Arul Anandar College, Madurai. With a B.Sc. in Physics from Bharathidasan University, I bring analytical rigor and technical expertise in Python, SQL, Power BI, Tableau, Excel, Machine Learning, and AI. I have completed multiple data-driven and AI-powered projects that showcase my ability to derive actionable insights from complex datasets and build intelligent systems. These include AI-powered Sales Forecasting with machine learning models achieving 85% accuracy, NLP Sentiment Analysis achieving 92% classification accuracy, Computer Vision for image recognition, and AI-driven Recommendation Systems. Additionally, I have worked on Olympics Data Analysis with predictive models, Supermart Sales Analytics with interactive dashboards using Power BI and Excel, and developed a Blog Website applying full-stack web development skills. My strengths lie in data cleaning, exploratory data analysis (EDA), data visualization, machine learning model development, and translating data into actionable business insights. I am passionate about solving real-world problems through AI and continuously expanding my expertise in analytics, business intelligence, artificial intelligence, and web technologies.
Projects
Web
Completed
St. Joseph's College (Autonomous), Tiruchirappalli Β· Mar 2024
I am delighted to share that I have been awarded the Certificate of Merit during the 180th College Day. This recognition was for securing the First Rank in Allied: Computer Science 2 (Semester 4).
View CertificateSt. Joseph's College (Autonomous), Tiruchirappalli Β· Mar 2023
I am delighted to share that I have been awarded the Certificate of Merit during the 179th College Day. This recognition was for securing the First Rank in Allied: Computer Science 1 (Semester 3).
View CertificateArul Anandar College (Autonomous), Madurai Β· Mar 2026
I am delighted to share that I have been awarded the Certificate of Merit during the 56th College Day. This recognition was for securing the First Rank in Major: Computer Applications.
View CertificateNoviTech R&D Pvt Ltd Feb-2025 to Apr-2025
During my internship at Novitech, I gained hands-on experience in data analytics, working on real-world projects to collect, clean, analyze, and visualize data. I learned to use tools like Excel, SQL, Power BI, and Python for data analysis and reporting. My responsibilities included interpreting complex datasets, identifying key insights, preparing dashboards, and assisting in data-driven decision-making processes. The internship strengthened my analytical thinking, problem-solving abilities, and technical skills, preparing me for professional roles in the data analytics field.
Unified Mentor May-2025 to June-2025
I successfully completed a one-month Data Analytics internship at Unified Mentor, where I gained practical experience in handling and analyzing data. During the internship, I worked on real-world datasets, performing tasks such as data collection, cleaning, and preprocessing using tools like Excel, SQL, and Python. I conducted exploratory data analysis (EDA) to uncover meaningful insights and patterns, and created data visualizations using tools such as Power BI and Matplotlib to present findings in a clear and effective manner. The internship also enhanced my understanding of key data analytics concepts including statistical analysis, trend identification, and data-driven decision-making. This experience strengthened my technical skills and gave me valuable exposure to working in a collaborative, results-oriented environment.
This project demonstrates a complete end-to-end data analytics workflow, transforming raw data into meaningful insights. It includes data cleaning, analysis, and interactive dashboard visualization to support business decisions.
Workflow:
Technologies Used:
Python, Pandas, NumPy, SQL, Power BI, Excel
Key Insights:
Live Dashboard:
View Dashboard
GitHub:
View Code
This Power BI dashboard highlights a moderate patient load in June with an average wait time exceeding 30 minutes. The patient satisfaction score slightly surpasses the norm, while 201 readmissions were noted. Insights help uncover patterns and performance improvement areas.
Tools Used: Power BI, DAX, SQL, Excel
View Live Dashboard: Click here
I developed an interactive Power BI dashboard inspired by Game of Thrones, analyzing all 8 seasons for episode performance and audience trends. The dashboard highlights season-wise IMDb ratings, top-rated and most-watched episodes, director distribution, and runtime analysis. I applied DAX functions like ranking, CALCULATE, and SELECTEDVALUE along with Top N filters and dynamic tooltips. The project uncovers insights such as highest-rated episodes, viewership growth trends, and runtime impact on ratings. This enhanced my skills in data storytelling, dashboard design, analytical thinking, and business intelligence concepts.
Tools Used: Power BI, DAX, SQL, Excel
View Live Dashboard: Click here
I created an interactive Power BI dashboard inspired by Stranger Things, analyzing Seasons 1β5 to uncover trends in ratings, episodes, and viewer engagement. The dashboard provides a comprehensive overview of total seasons and episodes, along with an in-depth analysis of average IMDb ratings and season-wise rating trends. It includes a rating versus target comparison, season-wise viewer counts, episode-level rating distribution, and a title-wise IMDb rating breakdown. Multiple datasets such as episode details, ratings, viewership data, and metadata were modeled to ensure meaningful insights. Using Power BI, DAX measures, data modeling techniques, and interactive visuals, I designed a cinematic dark-themed UI aligned with the showβs aesthetic. This project strengthened my skills in data storytelling, KPI structuring, visual hierarchy design, advanced formatting, and dashboard optimization while enhancing my ability to combine analytics with creative design.
Tools Used: Power BI, DAX, SQL, Excel
View Live Dashboard: Click here
The dataset focuses on employee attrition analysis to identify factors influencing turnover and retention, along with demographic and departmental insights to understand workforce diversity. It also explores job satisfaction, performance trends, compensation, and promotion patterns to assess engagement and career growth. Additionally, it includes work-life balance indicators and predictive insights to support data-driven HR decision-making.
Tools Used: Tableau, SQL, Excel
View Live Dashboard: Click here
I developed a dynamic Power BI dashboard titled βShopify Sales and Customer Funnel Reportβ to analyze sales performance and customer behavior. It showcases $41.8M in net sales from 7,534 orders, with insights into repeat purchase rate (46%), customer lifetime value ($943.6), and product trends. The report visualizes sales by time, product type, payment method, and region, highlighting running shoes and Shopify Payments as top performers. Interactive slicers for sales, gateway, and province enable data-driven decision-making and reflect my expertise in Power BI and business analytics.
Tools Used: Power BI, DAX, SQL, Excel
View Live Dashboard: Click here
The Competitive Market Analyzing Report provides key insights into market trends, competitor performance, and customer behavior. It highlights sales distribution, pricing strategies, and brand positioning to evaluate market strength. This analysis supports data-driven decision-making for improving competitiveness and business growth.
Tools Used: Power BI, DAX, SQL, Excel
View Live Dashboard: Click here
A modern, responsive personal portfolio website developed to showcase data analytics projects, Power BI dashboards, certifications, and professional experience. Designed with a dark UI theme to enhance visual appeal and recruiter engagement.
Completion Time: 2 Weeks
Technologies Used: HTML, CSS, JavaScript, Bootstrap
Live Project: View Website
A Campus Recruitment Management System is a web-based application that automates and streamlines the campus hiring process. It manages student profiles, company job postings, and recruitment drives efficiently. The system enables role-based access for students, recruiters, and administrators. It reduces manual effort and improves transparency and accuracy in placement activities.
Completion Time: 3 Months
Technologies Used:
Front End : Php, JavaScript, Bootstrap,
Back End : MySQL
Live Project: View Website
a Blog and Q&A Website built to promote educational collaboration and interactive learning. The platform lets users create blogs, upload multimedia, like/dislike posts, ask questions, and share answers, while admins maintain quality and system security.
Completion Time: 5 Months
Technologies Used:
Front End : Php, JavaScript, Bootstrap,
Back End : MySQL
Live Project: View Website
Gained foundational knowledge in data analytics, including data collection, cleaning, visualization, and interpretation using tools like Excel and SQL. Learned to apply analytical thinking to real-world business problems and generate actionable insights.
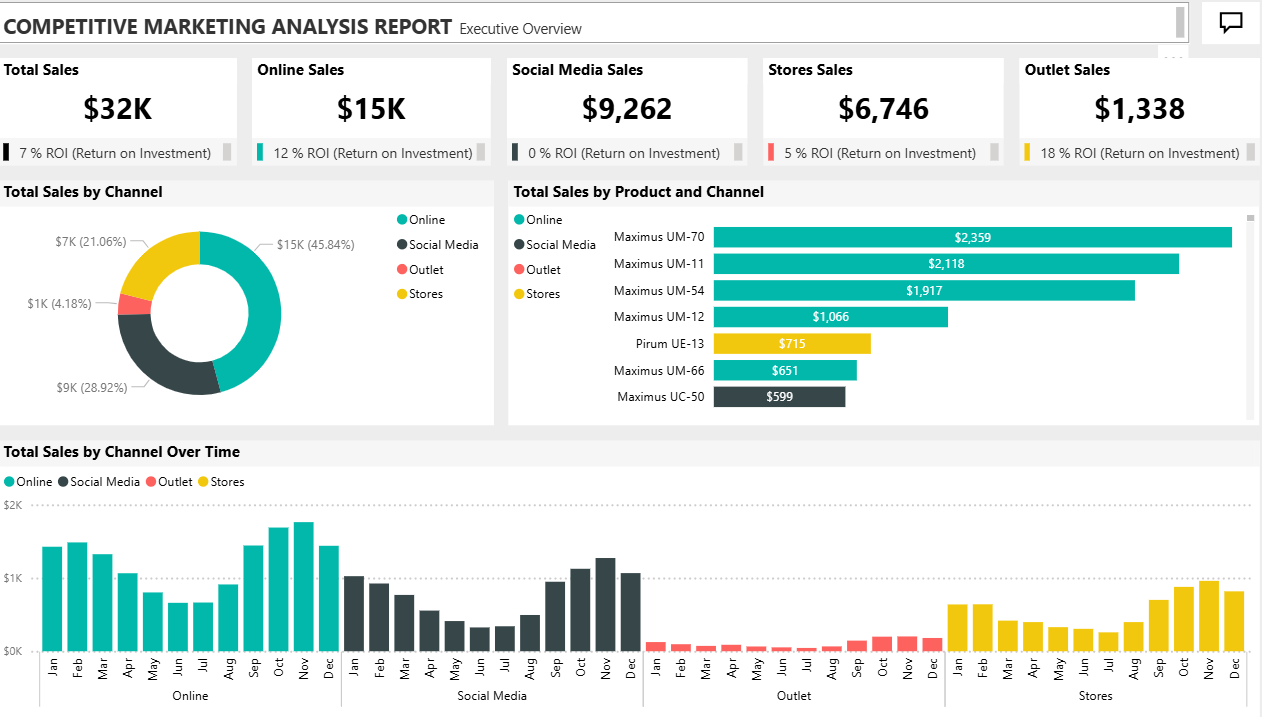
Completed a Deloitte job simulation involving data analysis and forensic technology. Created a data dashboard using Tableau. Used Excel to classify data and draw business conclusions
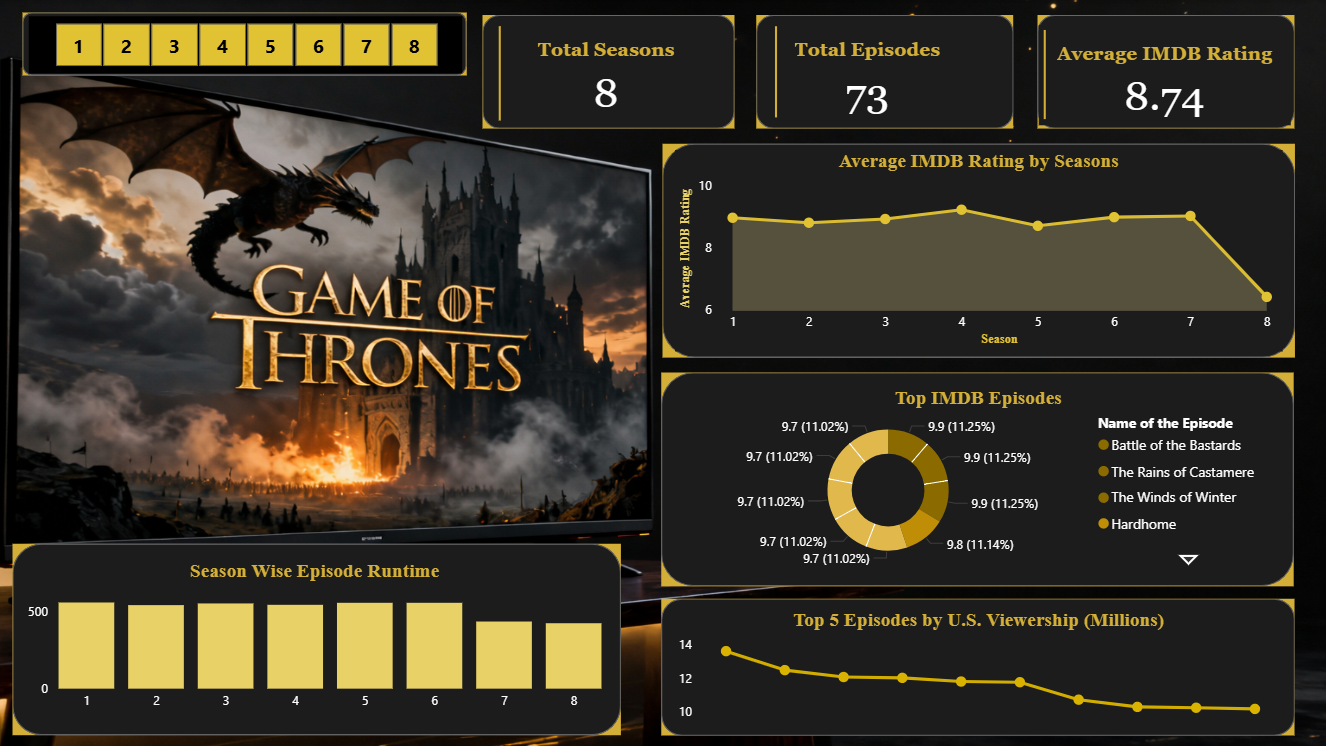
Participated in a Power BI workshop organized by TechTip24, where I gained hands-on experience in creating dynamic dashboards and visual reports. The session enhanced my understanding of data modeling, DAX functions, and business intelligence reporting.
Gained foundational knowledge in data analytics, including data collection, cleaning, visualization, and interpretation using tools like Excel and SQL. Learned to apply analytical thinking to real-world business problems and generate actionable insights.
Participated in a Power BI workshop organized by the United Latino Students Association, where I learned to build interactive dashboards and perform business data analysis using real-world datasets. The workshop strengthened my skills in data visualization and business intelligence.
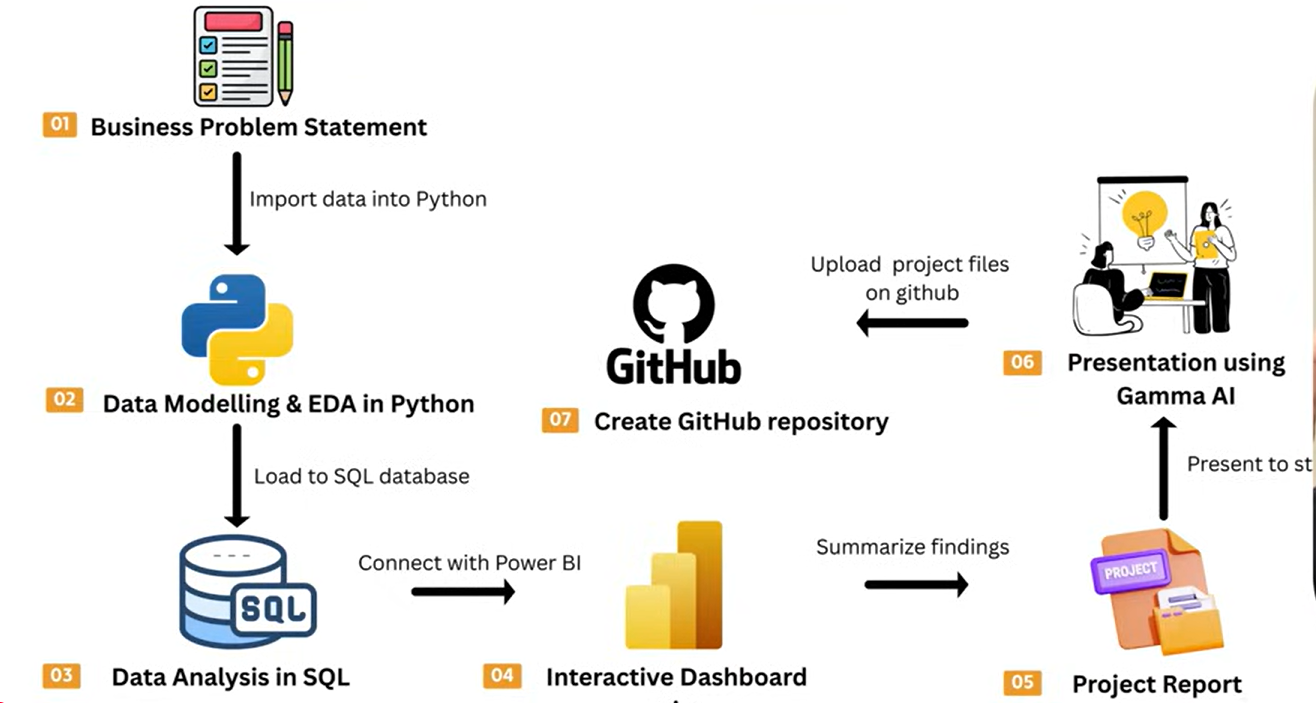
At Novitech, I completed an in-depth training program in Data Analytics, where I learned the complete workflow β from data cleaning and transformation to visualization and predictive insights. This experience enhanced my technical and analytical problem-solving skills.
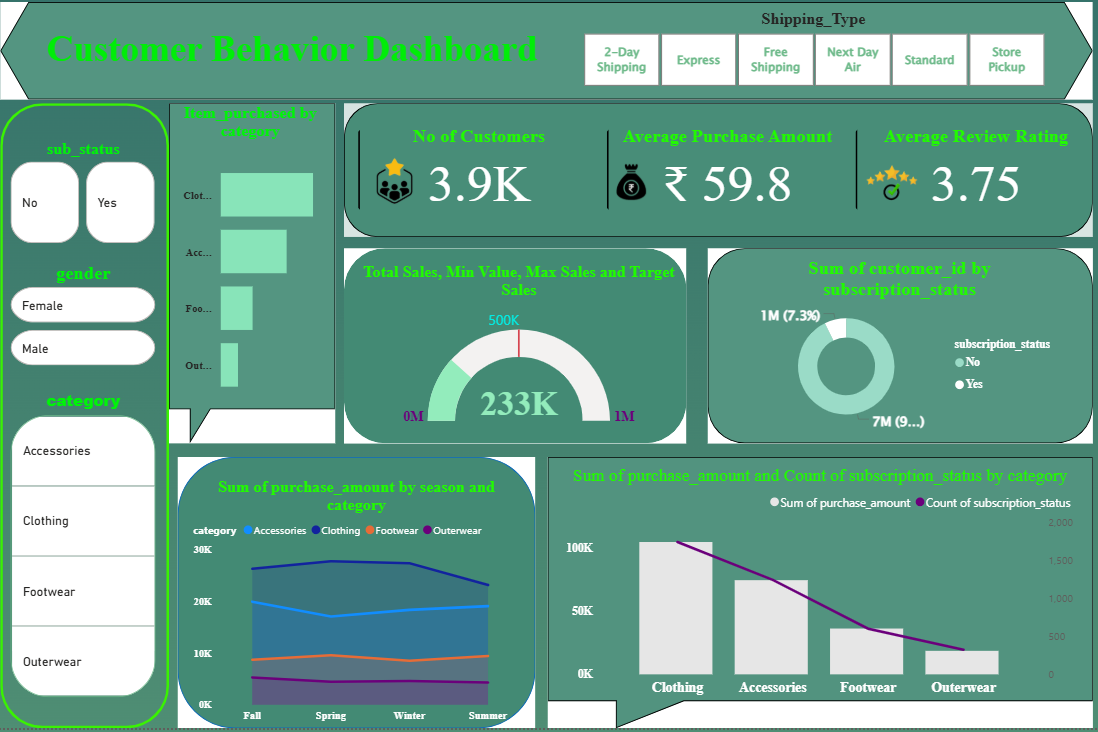
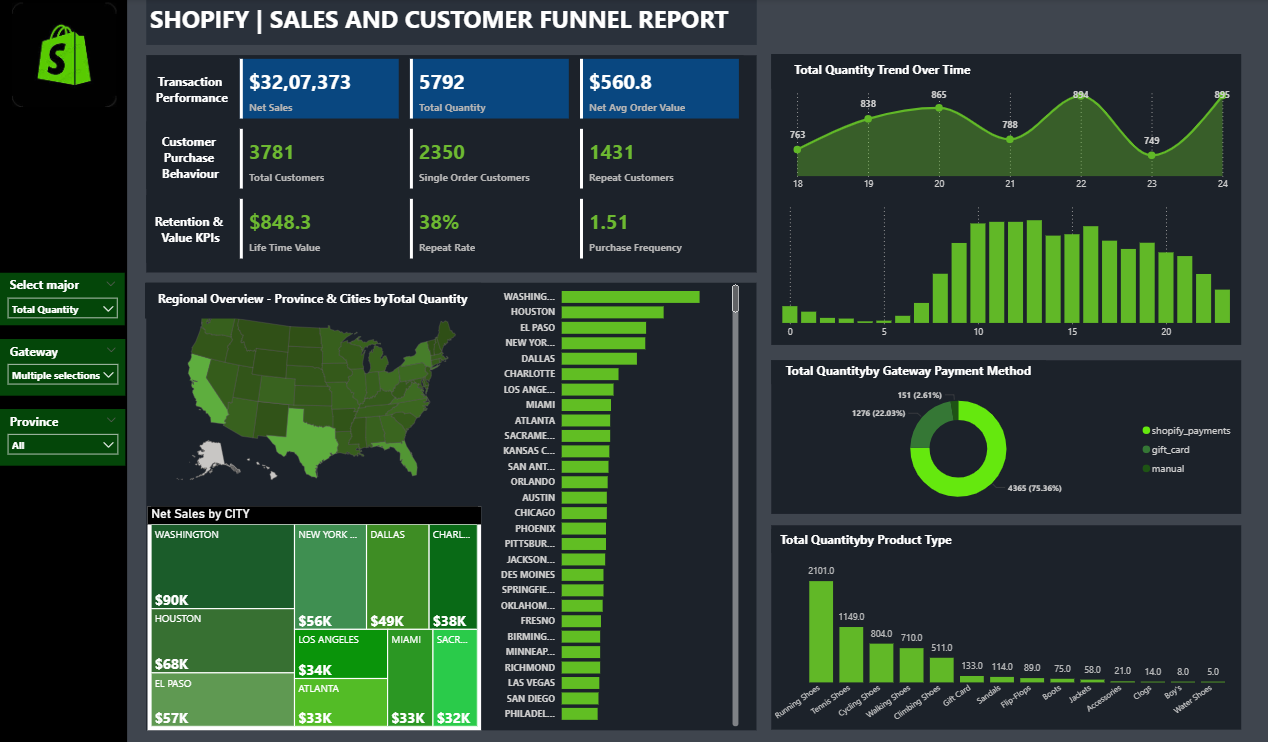
During my internship at Unified Mentor, I worked on two real-time data analytics projects: Olympics Dataset Analysis β explored athlete performance, medal trends, and country-wise statistics. Supermarket Sales Analysis β analyzed customer behavior, sales trends, and revenue patterns using data visualization techniques.